

Monitor density and workspace comparison
Compare two displays by pixel density, active dimensions and approximate logical workspace at an entered scale.
AV & workplace
Monitor density and workspace comparison
Compare two displays by pixel density, active dimensions and approximate logical workspace at an entered scale.
Example inputs · Replace these with your measurements to build your plan.
Method, example and sources
- Find the pixel diagonal with the Pythagorean relationship.
- Divide by active diagonal inches to obtain pixels per inch.
- Use pixel aspect to derive active width/height and divide native resolution by UI scale for an approximate logical workspace.
- Compare mounting, video bandwidth and application scaling separately before choosing the desk configuration.
Worked example. 3840 × 2160 at 27 inches is about 163.18 ppi; the same resolution at 32 inches is about 137.68 ppi. At 150% scaling, the first screen has an approximate 2560 × 1440 logical workspace.
Your planning result
Pixel density and scaled workspace
Physical size, native pixel count and UI scale answer different questions. Logical dimensions are a scaling approximation.
- Display A density
- 163.178ppi
- Display B density
- 137.682ppi
- B versus A density change
- -15.625%
| Display | Active width in | Active height in | Approx logical width | Approx logical height |
|---|---|---|---|---|
| A | 23.533 | 13.237 | 2560 | 1440 |
| B | 27.89 | 15.688 | 3072 | 1728 |
- Use active diagonal, not chassis dimensions. Bezels, pixel aspect, OS rounding and per-application DPI behavior are not modeled.
- PPI does not establish readability for an individual, refresh performance, color quality or docking compatibility.
From the catalog
Monitors
Explore related listings, then confirm the exact model requirements against your plan. These listings are not an automatic compatibility or capacity verdict.
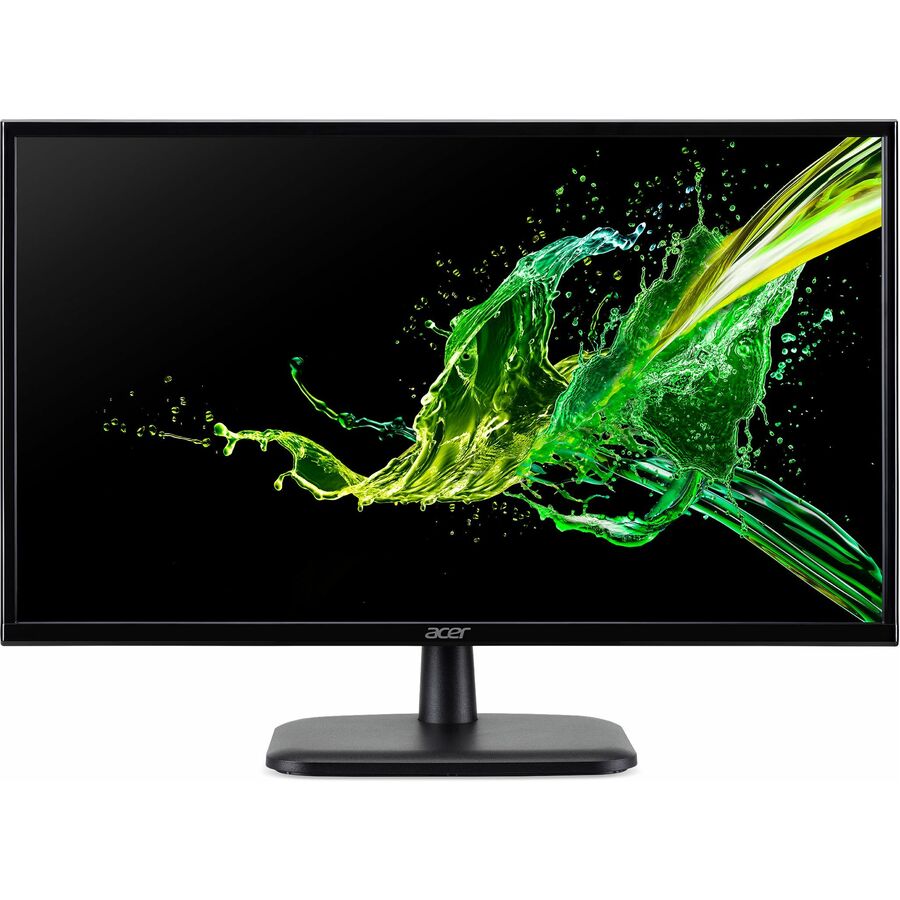
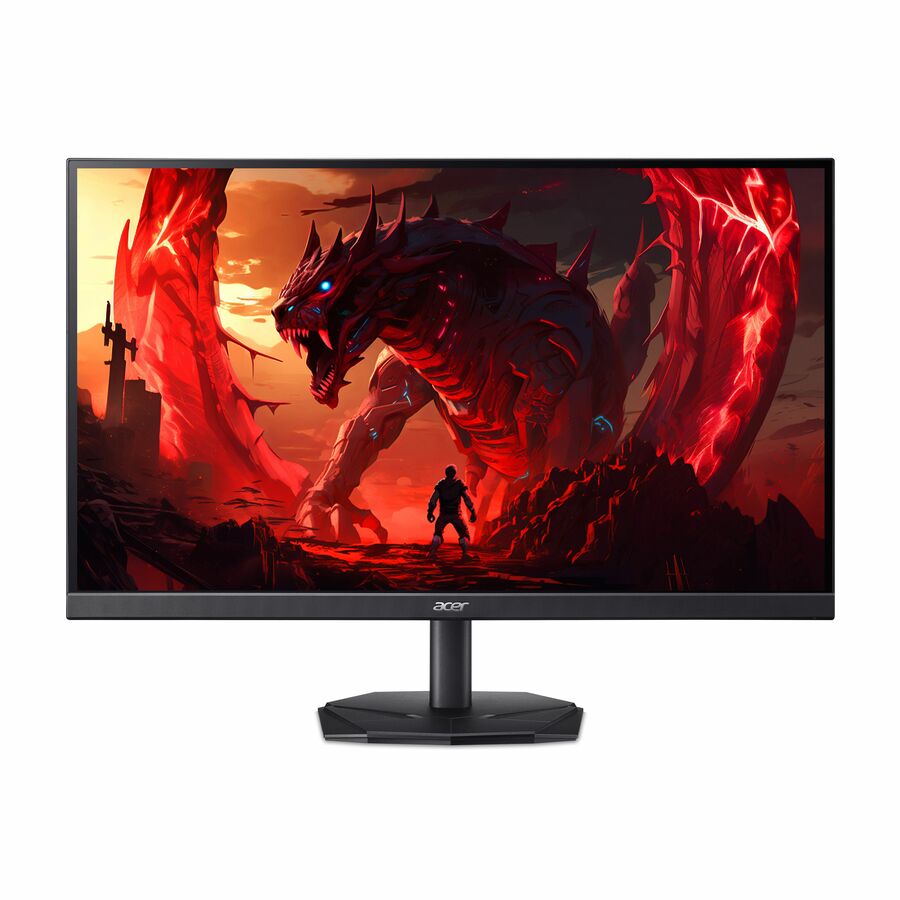
- AcerAcer EK321Q H 32" Class Full HD LCD Monitor - 16:9 - Black - 31.5" Viewable - Vertical Alignment (VA) - LED Backlight - 1920 x 1080 - 16.7 Million Colors - VESA Adaptive Sync (DisplayPort VRR) - 250 Nit - 1 ms - 100 Hz Refresh Rate - Speakers - HDMI - VGA - DisplayPort - VESA Mount Compatible - SpeakerUM.JE1AA.H03
$229.99
$170.63
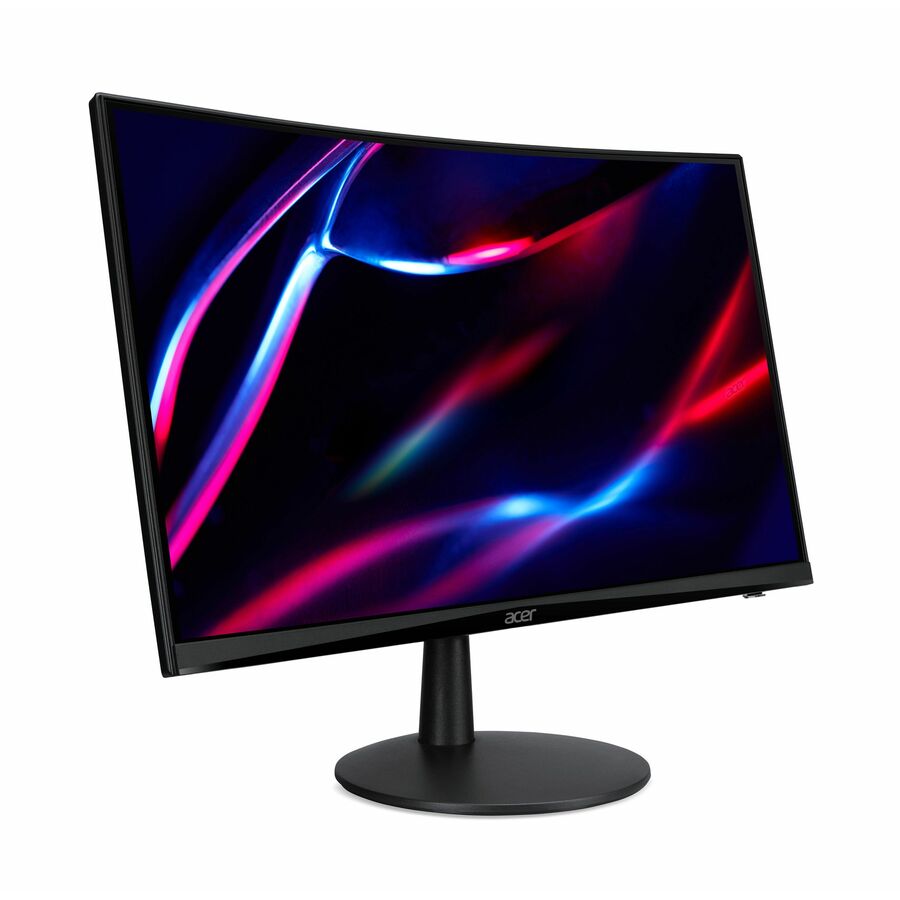
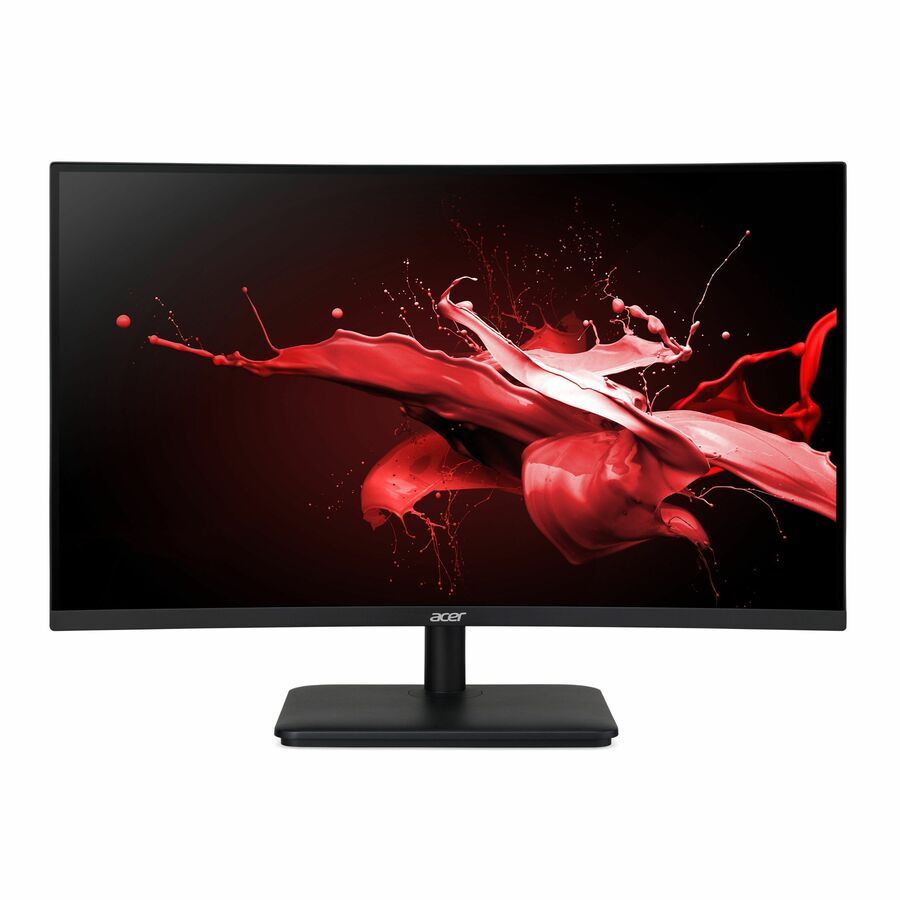
55 in stock - AcerAcer Nitro ED270 Z 27" Class Full HD Curved Screen LCD Monitor - 16:9 - Black - 27" Viewable - Vertical Alignment (VA) - LED Backlight - 1920 x 1080 - 16.7 Million Colors - AMD FreeSync Premium (DisplayPort VRR) - 250 Nit - 1 ms - 240 Hz Refresh Rate - Speakers - HDMI - DisplayPort - VESA Mount Compatible - SpeakerUM.HE0AA.Z01
$427.28
$403.78
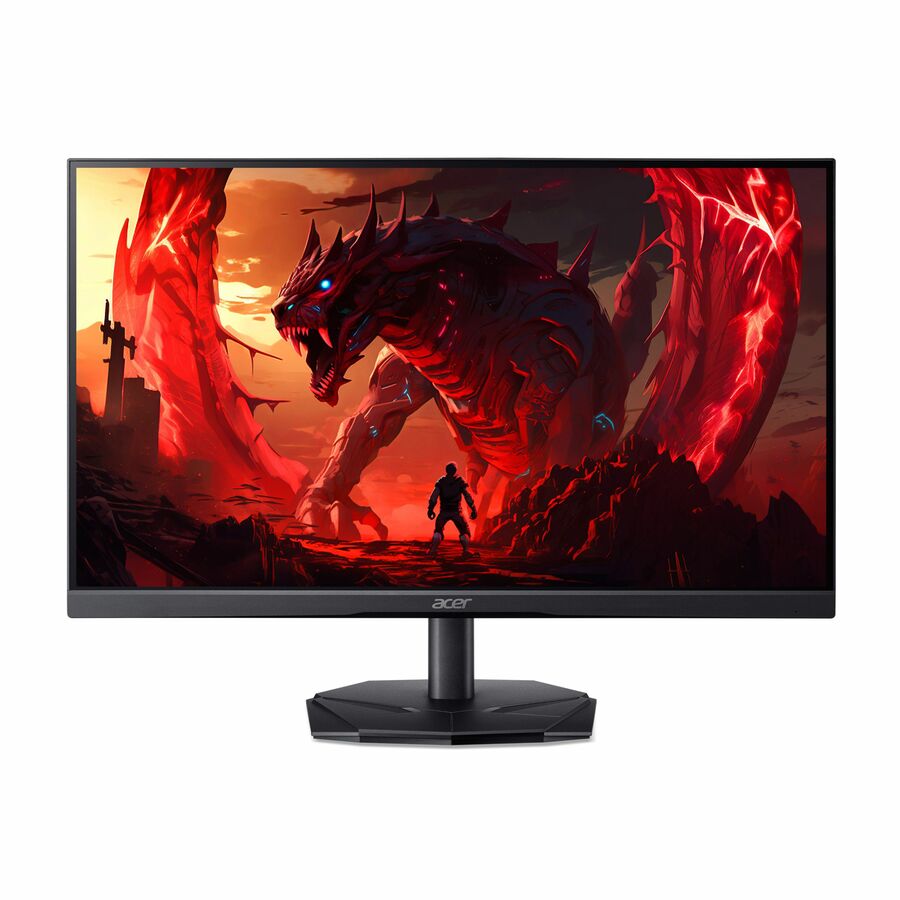
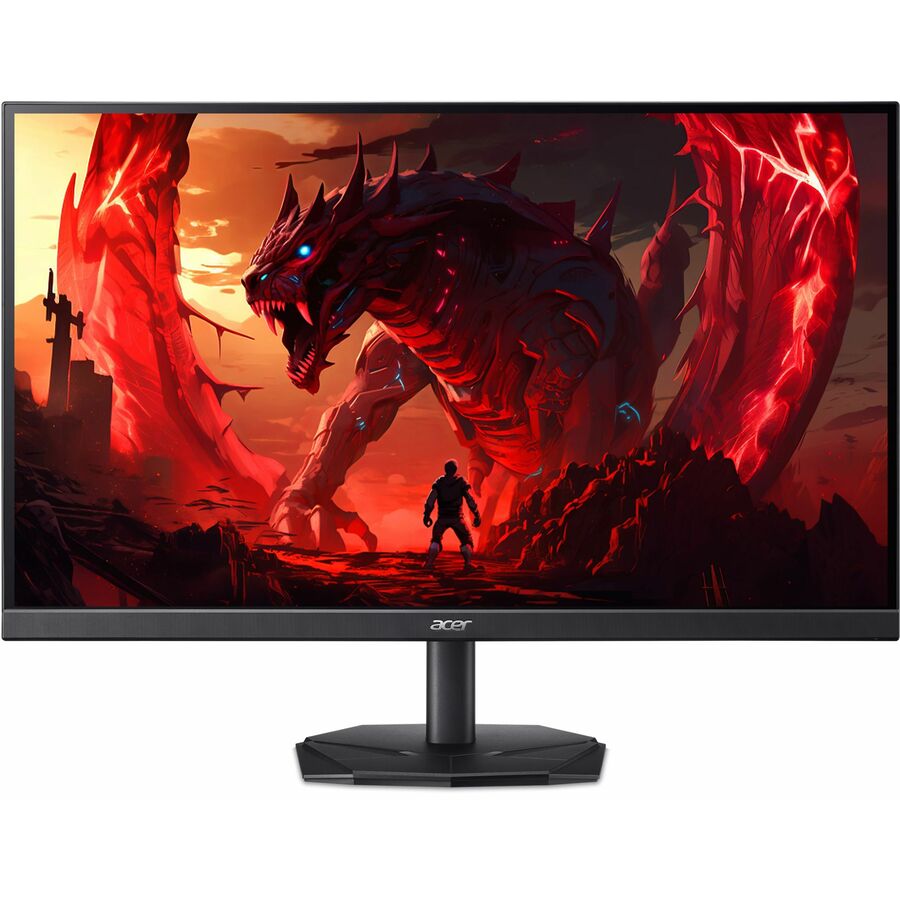
5 in stock - AcerAcer Nitro KG251Q P3 25" Class Full HD Gaming LCD Monitor - 16:9 - Black - 24.5" Viewable - Vertical Alignment (VA) - LED Backlight - 1920 x 1080 - 16.7 Million Colors - AMD FreeSync (DisplayPort VRR) - 250 Nit - 2 ms - 180 Hz Refresh Rate - Speakers - HDMI - DisplayPort - VESA Mount CompatibleUM.KX1AA.302
$273.15
$258.12
9 in stock - AcerAcer Nitro KG271U N3 27" Class WQHD Gaming LCD Monitor - 16:9 - Black - 27" Viewable - In-plane Switching (IPS) Technology - LED Backlight - 2560 x 1440 - 16.7 Million Colors - AMD FreeSync (DisplayPort VRR) - 250 Nit - 0.50 ms - 144 Hz Refresh Rate - Speakers - HDMI - DisplayPort - VESA Mount Compatible - SpeakerUM.HX1AA.307
$342.27
$323.45
3 in stock

What the result means
A larger diagonal does not necessarily provide more workspace. Native resolution decides the pixel grid, while the physical diagonal decides how densely those pixels are packed. Operating-system scaling then changes the approximate logical area available to applications. Comparing all three prevents a higher-resolution label from concealing a smaller effective work area at the scale a person actually uses.
Before choosing a product
These geometric quantities do not predict visual comfort, text rendering or color quality. Applications differ in how they handle per-monitor DPI, and the operating system can round logical sizes. Confirm the display’s active dimensions, panel and refresh characteristics, mounting mass and full host-to-display video path. Use the comparison to prepare a desk requirement rather than prescribe an individual ergonomic or medical outcome.
Worked example
3840 × 2160 at 27 inches is about 163.18 ppi; the same resolution at 32 inches is about 137.68 ppi. At 150% scaling, the first screen has an approximate 2560 × 1440 logical workspace.